Trend Following the Commodity Supercycle
Introduction
Whether or not we are on the cusp of the next commodity supercycle is a hot topic right now. How do we define a supercycle? A phenomenon characterised by an extended period (we’re talking potentially decades here) of above-trend movements in a wide range of commodity prices, due to a structural demand shift. It is no secret that commodity prices appear to have awoken from their decade-long bear market and are generally enjoying a rally. Is the asset class simply recovering from the depths of the pandemic or has there been a structural shift to a long-term bull market? From the current Covid-19 mitigating measures that are disrupting supply chains, to the potential long-term behavioural changes that may alter the demand for goods, for good; the ramifications of the pandemic’s impact on global markets are wide-ranging and it is unknown how long they will persist.
Increasing urbanisation and industrialisation, led by China, turbocharged metals prices in the 2000s and helped drive the last commodity supercycle, with some commodity prices peaking in 2011. Ten years on and there is a healthy pipeline of supportive factors for commodity demand, with the pandemic serving as a catalyst. Whether or not these factors play out into a supercycle we will leave for time (and the economists) to tell. Meanwhile, looking at the potential driving forces yields an interesting conversation and highlights a market environment with plenty of profitable opportunities for CTAs to seek to capture.
Potential Commodity Supercycle Drivers
China: World economies are at different stages of their pandemic recovery. The only major economy to post gains for 2020 was China. As the world’s biggest buyer of natural resources, accounting for more than 50% of global demand for many commodities, and with a Covid-19 relief package overwhelmingly focussed on infrastructure, Chinese manufacturing appears to be the engine underlying recent physical consumption growth. Suppose Chinese momentum moderates at some point and this effect tempers, what are the other effects at play?
US Dollar: Last March when the pandemic began to roil markets, the priority for many shifted to cash and demand for US Dollars spiked. Consequently, the US Dollar Index, which is a weighted average of the US Dollar’s exchange rate against six other widely traded currencies, rose sharply. The US Federal Reserve responded by opening swap lines with other central banks to ease the US Dollar shortage. For the remainder of the year the US Dollar declined as risk appetite revived, making commodities relatively cheaper for holders of other currencies (given many commodities are priced in US Dollar terms).
Stimulus and Economic Growth: Global policymakers have also played their part. Monetary and fiscal policy are known as the tools used to influence a country’s economic activity. Monetary policy tends to indirectly impact the real economy via interest rates and control of the money supply, while fiscal policy targets direct impact through taxation and government spending. The past decade (and then some) has predominately been focussed on monetary policy. Last year saw fiscal policy re-establish itself, with approximately USD14tn of fiscal actions taken according to the International Monetary Fund. The injection of cash into economies has undoubtedly helped drive the economic recovery, potentially pushing strong GDP growth in the future and fuelling commodity demand.
Inflation Expectations: With the prospect of strong growth comes heightened inflation expectations, which are at their highest levels in around a decade as demonstrated by the US breakeven rate in Figure 1. An outlook that increasingly points to inflation turns investors’ attention to inflation hedges, which commodities are often considered to be. Many will cast their minds back to the 1970s, dominated by stagnant growth and double-digit inflation; the best performing asset class in that time was commodities.
Figure 1: Bloomberg Commodities Total Return Index and US Breakeven Rate: Jan 2003 to Feb 2021

Note: Please see disclaimers at the base of this page.
Climate Focus: An even longer-term theme that could keep commodity prices (and more specifically metals) elevated, is the combat against climate change. We have seen the green energy transition gather pace in recent times. Joe Biden signed the US back into the Paris Treaty on his first day in office and has promised a ~USD2tn climate-focused infrastructure plan. Meanwhile, a number of countries including the United Kingdom, France, Japan and China have set legally binding targets on achieving net-zero emissions in the next 25 to 30 years. As emission standards are tightening, energy is evolving. There has been a growing interest globally in electric vehicles (EV) and the materials needed to make them: aluminium helps build lighter vehicles; nickel helps power the vehicles; and copper is used in nearly every major component of EV. Copper (which we wrote about last year, see “Trends of the Unexpected”) appears to be the biggest star of the show given it has many useful properties that make it a core input for manufacturing and electrification: high durability, high malleability, high electrical and heat conductivity, no loss of quality upon recycling. The list goes on. Copper’s rally last year outpaced broad commodities and stands shoulder to shoulder with global equities. Meanwhile, LME inventory levels dipped to their lowest levels in over 10 years as shown in Figure 2.
Figure 2: LME Copper Warehouse Inventory Volume and Price: Mar 2011 to Feb 2021

Note: Please see disclaimers at the base of this page.
Structural Underinvestment: All this has happened against the backdrop of a sector seemingly lacking in investment on the supply side. Many commodities go through highly “peaky” capital-expansion cycles as the ability to raise funds is correlated to price levels. So after over a decade of declining prices, new investment in various commodity sectors has waned in response. Most recently the pandemic added to this effect, as many producers cut production and delayed new projects. Low inventories can result in prices becoming far more responsive to an increase in demand, as there are long lags to bring new supply online for many commodity sectors. Supply-chain Purchasing Manager Indices are currently signalling fragility, with backlogs and delivery times continuing to rise and a growing number of firms reporting concerns about supplier performance.
Commodities at Aspect
While opinions are divided on the likely trajectory of commodity prices, what we can say with far more certainty is that commodities are not homogeneous, and their prices do not rise (or fall) uniformly. It is reasonable to assume that not all commodity prices will benefit equally from the pressures discussed above, nor is it implied that a supercycle or cyclical upswing would be a smooth ride.
The variability of commodity returns over the last 30 years is illustrated in Figure 3 using Bloomberg commodity sub-indices as a proxy. Momentum itself can be a weak effect that is challenging to identify against the background noise in markets and capture successfully. Aspect has been researching and developing trend following strategies to profit from momentum for over twenty years. By using sophisticated techniques, our trend following strategies are able to maximise the capture of persistent price moves when they do occur, while minimising the cost when a market is not displaying strong trends. By doing this systematically across a widely diversified portfolio of markets (including around 50 commodity futures spanning agriculturals, metals and energies), they are able to transform a weak effect into a compelling and diversifying return stream. Furthermore, the signals are directionally agnostic and unbiased, meaning they are equally likely to be long or short and so profits can be captured from both rising and falling prices. All in stark contrast to a passive, long-only investment.
Figure 3: Bloomberg Commodity Indices: Jan 1991 to Feb 2021

Note: Please see disclaimers at the base of this page.
The Aspect Diversified Programme is one of Aspect’s momentum-based investment strategies and has been trading since December 1998. At the core of the Programme is a price-based trend following strategy, which uses statistical analysis of market prices through time. This price-based component receives an 80% allocation of the long-term risk budget and is the main driver of the returns and positioning. The remaining 20% of risk is allocated to modulating factors. We believe that market participants do not simply look at price alone when making their investment decisions; there are other factors also driving aggregate market behaviour that we can capture and use to complement price-based trend following.
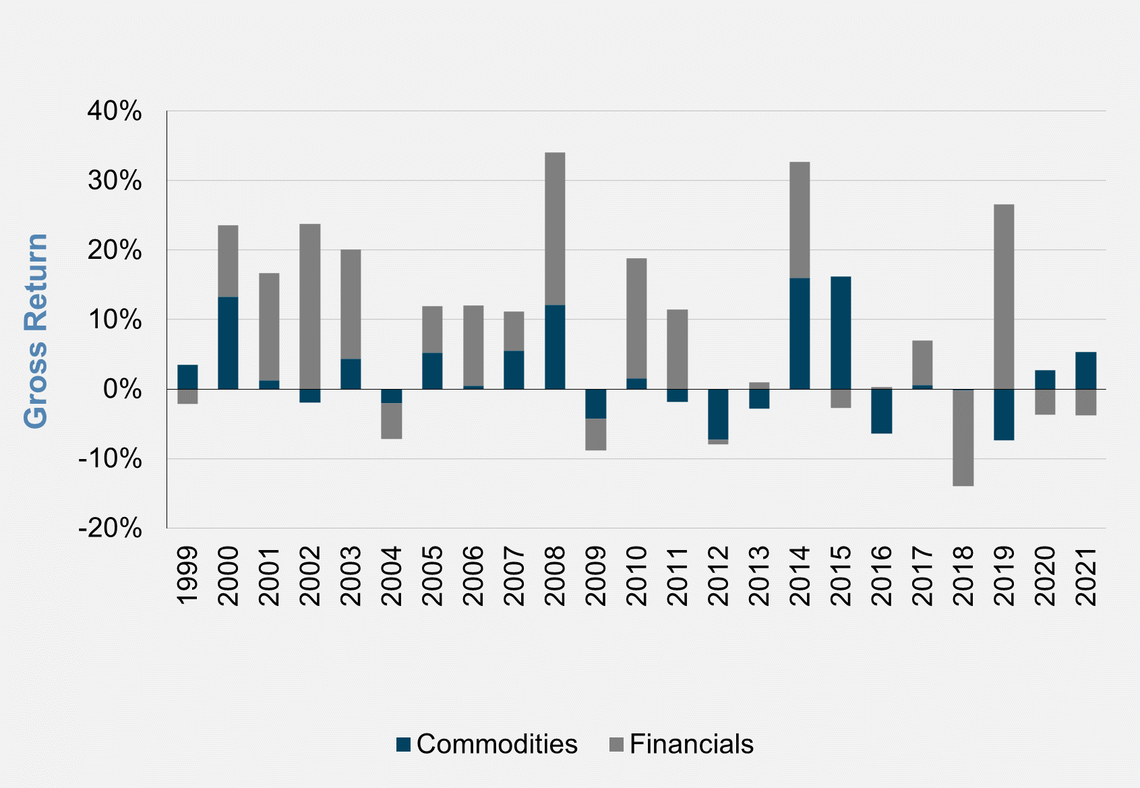
Figure 4 shows the Programme’s performance split by commodity and financial markets for each calendar year since inception, showing us that commodity-trending opportunities have been mixed over this time. In nine of the first twelve calendar years of trading, commodities generated profits for the Programme. The period from 2012 through to 2013 was challenging as a consequence of a lack of directionality in commodities markets. By 2014, a time when many commodity specialist managers seemed to have found the downward bias to market prices particularly difficult to trade, our directionally agnostic approach benefited from a range of strong bear trends. Commodities continued to be a key driver of performance as energy market prices declined through to 2015. The strong trend following opportunities that presented themselves in those two years were successfully captured by the programme, something a long-only passive investment would have struggled to replicate. Figure 5 illustrates how the Programme has dynamically deployed risk across sectors, with the marginal contribution to risk from commodities oscillating through time in response to the opportunity set present. It is this dynamism and ability to react that helps the Programme extract profits from medium-term trends when they exhibit themselves and defends assets when unfavourable conditions persist.
Figure 4: Aspect Diversified Programme Attribution by Sector: Dec 1998 to Feb 2021
Note: Past performance is not necessarily indicative of future results. Please see important disclaimers and net performance of the Programme at the base of this page.
Figure 5: Aspect Diversified Programme Simulated Sector Marginal Contribution to Risk: Dec 1998 to Feb 2021

Note: Past performance is not necessarily indicative of future results. Please see important disclaimers at the base of this page.
It would be hard to talk about commodity markets without mentioning those in China. International investors have historically faced many barriers to accessing Chinese markets, but China has been taking steps to open its domestic commodities futures market to the world. Up until a few years ago, the only way for offshore investors to trade in this market was by establishing a local entity – a fairly complex process laden with difficulties particularly in transferring money into and out of the country. Fast forward to March 2021 and half-a-dozen or so commodity futures are now open to direct participation by overseas investors, with more on the horizon. Chinese commodity futures have been met by a voracious appetite from international participants. Some of these futures now rank among the most heavily traded commodity futures in the world.
Figure 6 shows the top five traded commodity futures globally by sector in 2020, measured by the number of contracts traded on a roundturn basis to avoid double-counting. The data was collected from 80 exchanges in 33 countries. The majority of these top markets are Chinese futures, with the internationalised Chinese futures appearing in the top three of each of these sectors. As one of the world’s largest commodity marketplaces, Chinese commodity futures markets are highly liquid. The historical and current barriers to access have resulted in fewer international investors than traditional futures markets and offer an attractive further source of diversification to portfolios.
Figure 6: Top 5 Futures Markets Traded in 2020 by Trading Volume: Agriculturals, Metals and Industrials

Note: Please see disclaimers at the base of this page.
Aspect has been applying its systematic trend following models to onshore Chinese futures markets since 2016, via the Aspect China Programme, which generated positive results in 2020 and is performing well so far in 2021. The Programme allocates to 45 such markets, 40 of which are commodity markets and Figure 7 shows the Programme’s long-term risk allocation by sector. The Programme is currently available exclusively to onshore Chinese investors; however, given the strong interest from offshore institutional investors in gaining exposure to these markets - and importantly, their diversification benefits - we are in the process of establishing a fund vehicle to provide access to a version of the Programme to such investors in the coming months.
Figure 7: Aspect China Programme Long-Term Risk Allocation

Note: Please see disclaimers at the base of this page.
Closing Thoughts
At a time when bond yields have been declining to record lows and inflation fears have resurfaced, it would be hard for the relevance of commodities in investors' portfolio to be ignored. Investors may be looking to diversify into liquid, alternative strategies to reduce their reliance on equities and bonds and rebuild defensiveness into their overall portfolios.
Whichever way the commodity story plays out over the upcoming months or years, CTAs can provide an avenue to participate.
Authors
Joanne La Porte, Investment Solutions Analyst

Razvan Remsing, Director of Investment Solutions

Disclaimers
Source: Aspect Capital
Figures 1 to 3: Source: Datastream and Bloomberg. Note: The data with respect to various indices is shown for illustrative purposes only. Detailed descriptions of the indices used above are available from Aspect upon request.
Figure 4: Source: Aspect Capital Limited. Estimated performance. Individual sector attribution figures are gross and as such do not reflect the deduction of fees and expenses which would have lowered overall performance. The returns shown are uncompounded and do not include the reinvestment of any sources of earnings.
Figures 5: Source: Aspect Capital Limited. THESE RESULTS ARE BASED ON SIMULATED OR HYPOTHETICAL RESULTS THAT HAVE CERTAIN LIMITATIONS. UNLIKE THE RESULTS SHOWN IN AN ACTUAL PERFORMANCE RECORD, THESE RESULTS DO NOT REPRESENT ACTUAL TRADING.
Figures 6: Source: Futures Industry Association
Figures 7: Source: Aspect Capital Limited. Allocations are subject to change.
Any opinions expressed are subject to change and should not be interpreted as investment advice or a recommendation. Any person making an investment in an Aspect Product must be able to bear the risks involved and should pay particular attention to the risk factors and conflicts of interests sections of each Aspect Product’s offering documents. No assurance can be given that any Aspect Product’s investment objective will be achieved.
Live Monthly Aspect Diversified Programme Performance: Jan 1999 to Feb 2021

The Aspect Diversified Programme started trading on 15 December 1998. The performance data shown is net of the fees (and relevant crystallisation periods) applicable to this share class over time, currently a 2.00% management fee (accrued weekly and paid monthly in arrears) and 20.00% performance fee (determined and debited (if applicable) annually). The performance data shown above from January 2020 onwards has not been audited. The returns shown include the reinvestment of all sources of earnings. Past performance is not necessarily indicative of future results. Please see relevant risk disclaimers in the link below.
Aspect China Programme Live Net Performance: From 21st July 2016

The Aspect China Programme started trading on 21 July 2016. The returns are net of 2.00% management fee (accrued daily and paid monthly in arrears) and 20% performance fee (determined and debited (if applicable) quarterly). The live performance data used above has been provided by China International Capital Corporation (“CICC”) and has not been verified by Aspect. It is net of the management fees, performance fees and expenses - please contact CICC for further details of the fees and expenses applied. The returns shown include the reinvestment of all sources of earnings. Past performance is not necessarily indicative of future results. Please see relevant risk disclaimers in the link below.
To view our disclaimers relevant to this article, please click here.
SEC Marketing Rule
With effect from 1st November 2022, Aspect came into compliance with the U.S. Securities and Exchange Commission’s (SEC’s) new ”Marketing Rule”. This document was created prior to this date (“Old Material”) and therefore may not reflect certain requirements of the Marketing Rule. Please refer to the following website here for important disclaimers and other information required by the Marketing Rule, which are hereby incorporated into the Old Material by reference, to the extent applicable.


