Trend following led the way and may continue to do so
2022 will long be remembered for being a year of upheaval and change in economies and markets. But how did quantitative investment styles cope with these events? We summarise what did and didn’t work, using our growing collection of computer-driven models harnessing globally investable effects across multiple sectors (asset classes) and timeframes. They trade commonly-found liquid assets as well as harder-to-access assets such as European power contracts. They also use a range of techniques such as econometric and sentiment-based approaches.
As fate would have it, trend following, also known as (directional) momentum was by far the trendiest and best performing investment style last year. 2022 was a year of resurgence for CTAs, who typically make use of systematic trend following to harvest the momentum effect across a wide range of sectors. Inflation and inflation expectations became unanchored, and this phenomenon was both broad-based, globally widespread and exacerbated by an energy crisis stemming from the war in Ukraine. Central banks turned aggressively hawkish and recession fears grew substantially. Against this backdrop, bonds had one of their worst ever years, the US dollar had one of its best and stock markets tanked. The final quarter of the year saw reversals in some of these themes amid speculation that inflation had peaked, but the outlook remained gloomy.
We also look ahead and spell out why some themes may persist. It’s more likely that we’ll see a continuation than a reset in 2023, irrespective of whether rumblings of a policy pivot get louder.
1. Spotlight on Trend Following in 2022
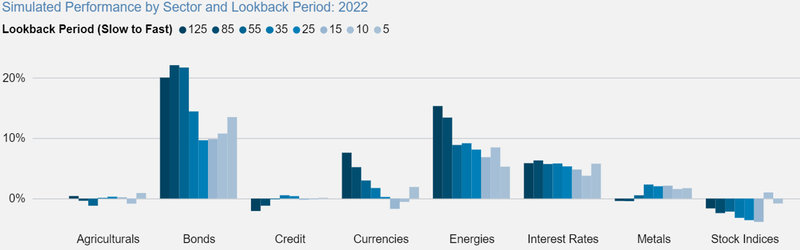
In order to illustrate how momentum fared, trend following systems were simulated across lookback periods and sectors (spanning ~200 global futures/forwards markets). The lookback periods range from as short as under a week to around six months. We combine the lookback periods to represent a medium-term trend following investment. The net sector positioning chart and performance heatmap below highlight a few points:


- Momentum was positive for most sectors: the bulk of gains came in Q1 but widespread momentum reversals occurred in Q4
- Fixed income maintained short positioning for the entire year and mostly profited for the first 3 quarters, with the notable exception being in July where safe haven appeal prevailed amid recessionary fears
- Long positioning was initially preferred amongst risk assets given the rallies in late 2021
- Stock markets were unsettled by higher volatility linked to tighter monetary policy, and switched to short positioning for the rest of the year
- Agriculturals and metals surged during Russia’s invasion of Ukraine, fuelled by supply concerns including a historic Nickel short squeeze. However, fears of policy driven demand destruction and China’s slowdown led to subsequent short positioning
- Momentum outperformed in energies despite giving back some gains in the second half of the year. The Ukraine conflict, Europe’s ensuing energy crisis and OPEC decisions created inflationary pressures
Breaking down performance by lookback period (shown below in number of days), we see that trading momentum slowly generally outperformed, in particular in bonds and energies. Trend following in stock indices, agriculturals and metals may have benefited from increased speed, but whipsaws were prevalent making for tough terrain in these riskier sectors.
2. Market Backdrop and Popular Trades in 2022
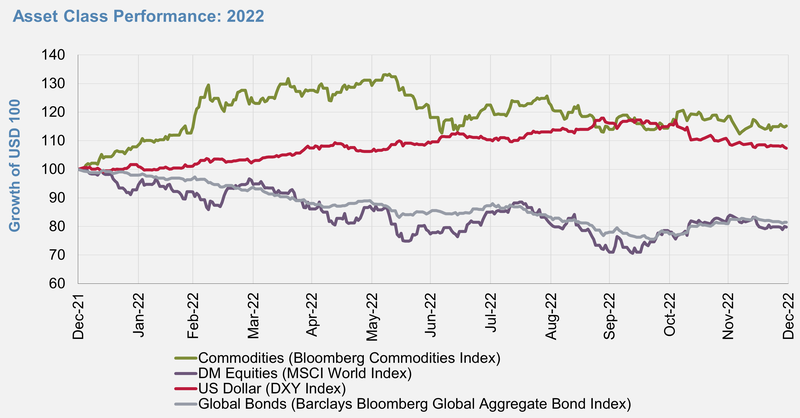
The chart above shows that there were clear strong trends in the major asset classes. However, it was not entirely smooth sailing, and some unwinds occurred. Bond volatility gradually rose towards historic extremes without much respite, and it increased a lot more than stock market volatility which also saw occasional upward bursts. Meanwhile, bond and stock markets appeared more closely correlated, challenging the diversification benefits sought in traditional long only 60/40 portfolios.
Below, we summarise some of the best performing consensus trades which endured for much of the year, though some of them reversed towards year-end. Notably, there have not been clear resolutions to many of their underlying drivers, so it would be reasonable to expect some more of the same in 2023.

3. Observations on Liquid Alternative Investment Themes in 2022
With diminishing returns in traditional asset classes, investors are increasingly seeking to reduce reliance on traditional long-only investments in favour of alternative investment themes such as the ones listed below. Each theme houses a set of models with common premises. Around 100 multi-asset models (almost all of which trade real client money as part of Aspect’s funds) were scaled to target the same volatility and their simulated 2022 positions and returns were analysed.
Table 1: Description of investment themes
| Theme | Common Premise |
|---|---|
|
Carry
|
Term structure is the main input |
|
Flows
|
Tracking the collective actions of investors |
|
Macro Fundamentals
|
Related to the distribution of resources in the global economy |
|
Momentum / Trend following
|
Directional moves are expected to persist |
|
Seasonality
|
Calendar effects are the main input |
|
Sentiment
|
Information that signals investor intent |
|
Slope/Curve
|
Focused on dynamism in yield curves |
|
Technical
|
Price-based techniques to capture behavioural biases |
|
Value
|
The price is wrong and should revert |
From the first performance heat map below, we can highlight a few observations:
- Momentum outperformance was driven by bonds, currencies, and energies despite whipsawed action in agriculturals, metals and stock indices
- Carry and Value were strong in stock indices. Carry often relies on a healthy dividend outlook but this was greatly reduced as companies revised their earnings outlook downwards. This led to profitable and sustained short positioning. Value within equities experienced a renaissance as sharp rate rises battered growth / tech-heavy indices, seen as previously overvalued
- Macro Fundamentals struggled to navigate financial assets in a year dominated by more technical indicators (momentum included), sentiment and seasonality
- FX Carry and Sentiment made gains from long US dollar positioning, particularly against the Japanese yen


Directional trading styles grabbed headlines, particularly in bonds, and this is exemplified in the second heat map above. Historic moves in energies and metals markets such as nickel propelled gains from directional models in those sectors. Cross-sectional models and those with a blend of directionality were performant in currencies.
Bonds drove significant risk and performance across portfolios of different styles. The US 10Y Note is a bellwether and arguably one of the most important markets so it was rather interesting to see how themes were positioned as the year went on.
US 10Y Note Future

- The majority of models within the Momentum theme got their US 10Y Note trades right for most of the year, mainly through short exposure which resonates with Momentum’s outperformance throughout the year
- Relatively stronger US fundamentals indicated long positioning which came unstuck in the face of rate hikes
- The US term structure offered attractive carry relative to other regions, but resultant long positioning detracted from performance. In Q3 and Q4, US Carry signals went short as other central banks enacted large rate hikes
- Seasonality in bonds often relies on spikes in buying and selling caused by aggregate institutional portfolio rebalancing transactions and short exposures from here were mostly profitable
- Slope / Curve themes on the US 10Y Note struggled amid attempts to put on relative yield curve flattener trades which went long the long end of the US yield curve whilst being short the short end
4. Conclusion and 2023 Outlook
- Directional momentum outperformed with short bonds, long USD, and long energies positions
- Trading momentum slower was preferred to faster speeds, similar to 2021
- Compared to 2021, higher volatility and correlations appeared across and between bond and stock markets
- Carry in FX and equities and Value in equities were bright spots
- More technical-based indicators outperformed more fundamental approaches
- Models with more directionality outperformed relative approaches in a year consisting of historic moves
What happens next? Well, the inflation story is far from finished. Moreover, the UK and parts of Europe may well already be in recession and the US is most certainly not out of the woods. Wage growth is still yet to catch up with headline inflation prints across the globe. China’s ongoing lockdowns have possibly suppressed inflation throughout the world, but work is underway to rollout a stronger vaccine which could see their economy reopen early in 2023.
There is still excess cash in the economy that needs to be drained, budget deficits are still unsustainable and unemployment rates have room to rise. Authorities still need to continue quantitative tightening, maintain high interest rates, and even increase taxes. These necessities should reduce cash in the private sector but risk inducing recessions which reduce credit demand and capital expenditure. The impacts of monetary and fiscal tightening usually manifest with a lag so haven't yet been fully felt.
As a result, the growth engines that power stock indices look weak, and bonds can't compensate. Liquid alternatives merit serious consideration and trend following in particular has demonstrated that it can provide that much needed support to portfolios time and time again.
Chart Disclaimer
All sources are Aspect unless otherwise stated. Data as at end of December 2022.
Unlike the results shown in an actual performance record, these results do not represent actual trading and are backtested. Results are calculated through the application of the strategy on historical market data. Hypothetical performance has many inherent limitations. One of the limitations of such performance is that results are generally prepared with the benefit of hindsight. No representation is being made that any account will or is likely to achieve profits or losses similar to those shown. There are frequently significant differences between such performance and the actual results subsequently achieved by any particular trading programme. PAST PERFORMANCE IS NOT INDICATIVE OF FUTURE RESULTS.
All figures are gross and as such do not reflect the deduction of fees and expenses which would have lowered overall performance. They have not been audited and do not include the reinvestment of all sources of earnings.
Any opinions expressed are subject to change and should not be interpreted as investment advice or a recommendation. Any person making an investment in an Aspect Product must be able to bear the risks involved and should pay particular attention to the risk factors and conflicts of interests sections of each Aspect Product’s offering documents. No assurance can be given that any Aspect Product’s investment objective will be achieved.
To view our disclaimers relevant to this article, please click here.


